
To see the amount of VRAM taken by a single process and monitor it on Windows 11, you can either use the basic Windows Task Manager and its additional columns available in the Details tab, or the Process Explorer app from Microsoft, which is available both as a standalone version and as a part of the Microsoft Sysinternals software package. Here is how to do it in just a few short steps.
You might also like: How To Run Automatic1111 With Less Than 4GB of VRAM
First Way – Windows Task Manager
The way to see per-process VRAM usage is really not that easy to find in the default Windows Task Manager. To access it you need to enable additional GPU data columns in the “Details” tab by right-clicking the column headers, and selecting “Select columns” to open a list where you can tick the appropriate boxes. Here is how to do it.
1. Get to the “Select Columns” Menu
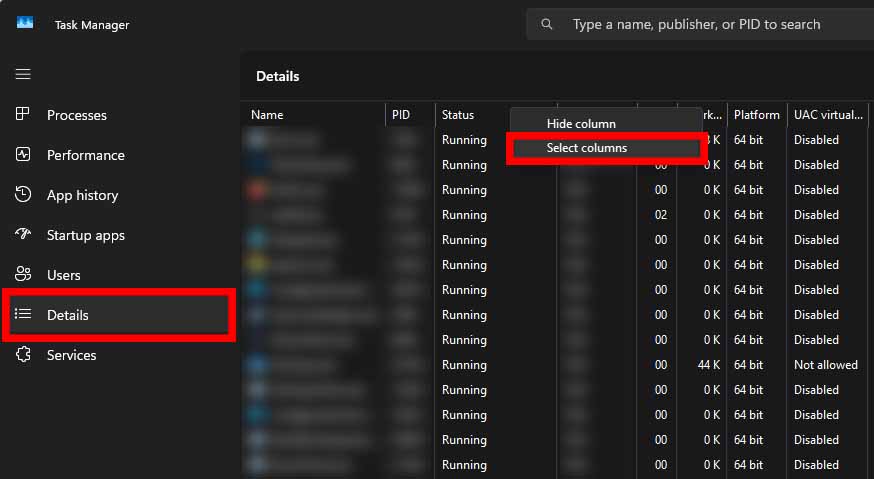
Open Task Manager, switch to the “Details” tab, then right-click on the column header row. From the context menu that appears, select “Select columns”. This opens a long list of additional per-process metrics that are hidden by default.
If you’re constantly running out of VRAM on your system, you might want to check this out: 12 Best High VRAM GPU Options This Year (Consumer & Enterprise)
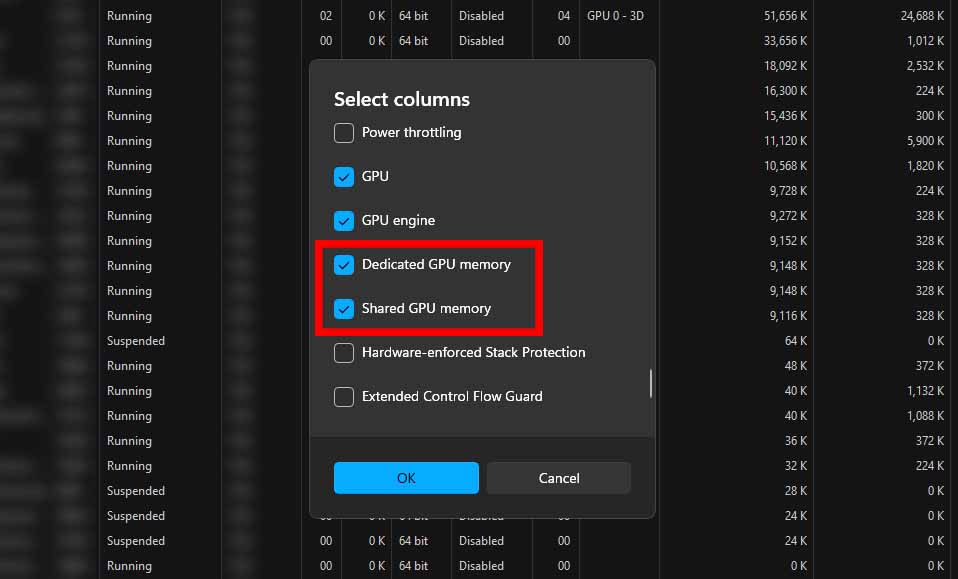
In the list of available columns, enable “Dedicated GPU memory”. This column shows how much actual video memory (VRAM) each process is currently using on the GPU.
Optionally, you can also enable “Shared GPU memory”, which represents GPU memory backed by system RAM instead of physical VRAM. If you see a memory-intensive process using a lot of Shared GPU Memory often in an attempt to automatically prevent an out-of-memory crash, your performance depending on the workflow can tank because your computer is making use of the slower System RAM instead of the fast video card memory.
This information can be really useful if you want to for instance, troubleshoot extreme compute slowdowns when running large language models locally on your system, or training LoRAs for diffusion models for image generation.
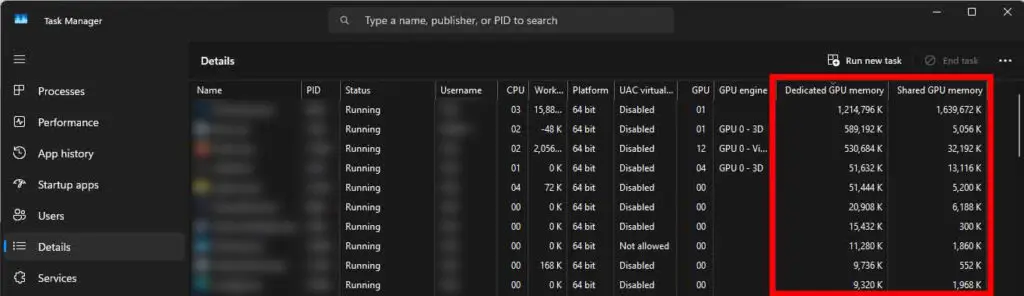
Once you do that, the two new columns will be displayed in the “Details” tab each time you open the task manager. That’s pretty much it. But there is another way, if you want to have access to even more interesting data, and it involves using the Windows Process Explorer.
If you’re not sure about the difference between dedicated and shared GPU memory, give this a quick read: What Is The Shared GPU Memory In The Task Manager?
Second Way – Windows Process Explorer
While Windows Task Manager gives you a basic per-process VRAM view, it is intentionally simplified. For a much more detailed and accurate look at process parameters, GPU memory usage, as well as per-process memory use charts, Microsoft provides an advanced tool called Process Explorer.
Process Explorer is an official program developed and distributed by Microsoft, and you can find it here. It’s part of the Sysinternals utilities package, similar in spirit to another collection of Windows power-user tools known as Microsoft PowerToys.
1. Download & Install Process Explorer
Download Process Explorer from the official Microsoft Sysinternals website here, extract the archive, right-click procexp.exe, and select “Run as administrator”. It’s a portable application, so you don’t have to install it to use it, and you can run it right away.
Note: Although you can run Process Explorer without Admin rights, it will not show GPU usage for system processes or processes running with higher privileges than your current user.
2. Enable GPU Memory Columns
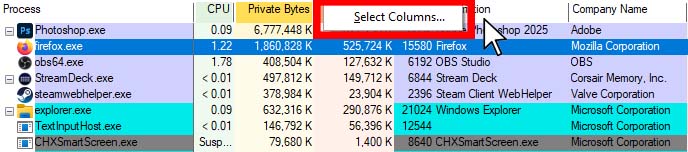
In Process Explorer, open the main view, locate the column headers near the top bar and right-click them. Then, click on the “Select Columns” option.
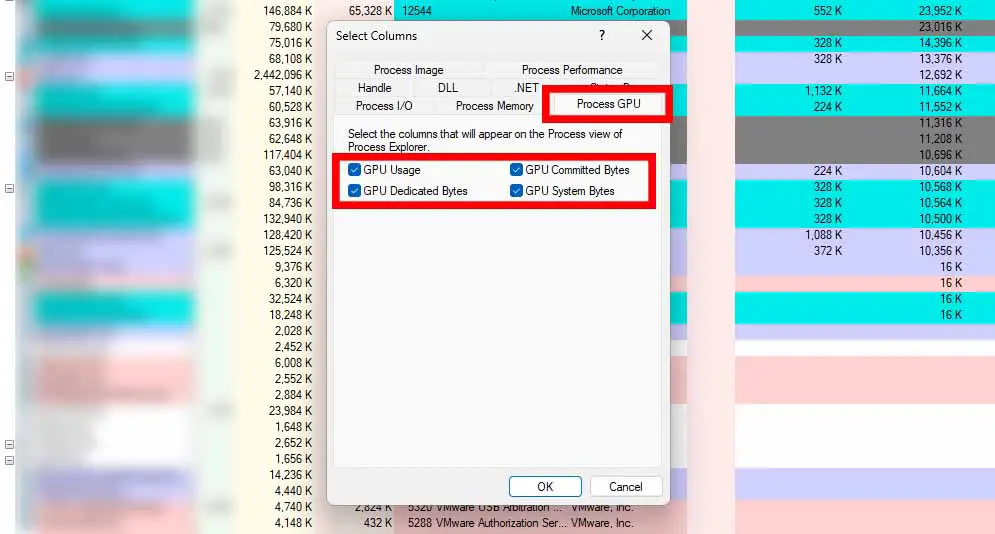
In the “Select Columns” menu, switch to the “Process GPU” tab. Here you can enable several GPU-related memory columns. Tick the GPU Dedicated Bytes (the actual VRAM currently used by the process), GPU System Bytes, and GPU Committed Bytes boxes, and exit the menu by pressing “OK”.
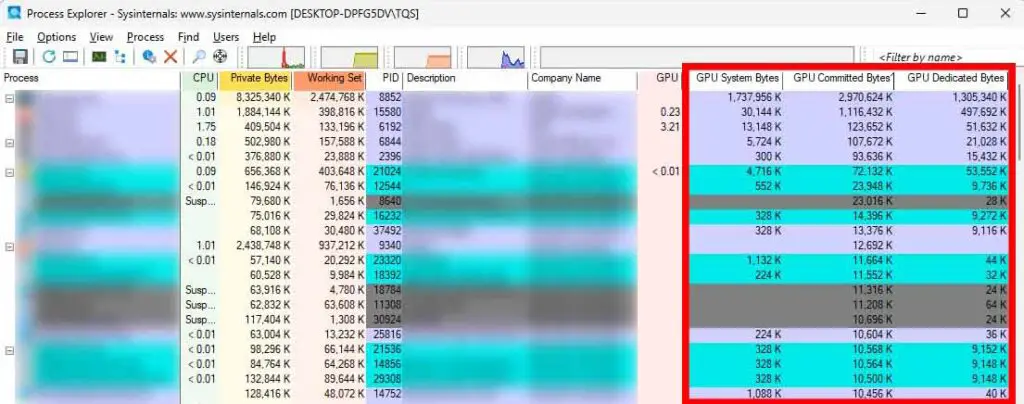
Once enabled, these columns give you similar information you can find in the Windows Task Manager, but presented in a different manner and with different names. Here is what each of these values mean:
What Do These GPU Memory Numbers Actually Mean?
When looking at GPU memory usage in Process Explorer, you’ll see multiple columns that may not be immediately obvious because of the way they are named. Here’s what each one represents in the practical terms:
- GPU Dedicated Bytes – This is the amount of actual VRAM currently being used by the process. It represents real, physical memory on the graphics card and is the closest thing to “true VRAM usage”. This corresponds to the “Dedicated GPU Memory” in the Windows Task Manager.
- GPU System Bytes – This is GPU memory backed by system RAM instead of VRAM. It’s typically used when VRAM is full, or on systems with integrated graphics. Accessing this memory is slower than dedicated VRAM. This is an equivalent of the Shared GPU Memory in the Task Manager.
- GPU Committed Bytes – This represents the total memory footprint requested by the application. In practical terms, it is equal to roughly the sum of Dedicated (VRAM) plus System (Shared RAM) bytes. In other words, it’s the total size of the assets the app has loaded, regardless of where they are currently sitting.
In short, Dedicated tells you what’s actually in VRAM right now, System tells you what’s spilling into RAM, and Committed tells you how much video memory the OS has “promised” the application overall.
If you want to learn more about how Windows and its graphics drivers handle video memory you can learn much more about that in the official Microsoft learning materials here:
If you’re planning on running some LLMs locally on your system, this might be of interest to you: LLMs & Their Size In VRAM Explained – Quantizations, Context, KV-Cache
Monitoring Your VRAM and Local AI Workflows
Keeping track of the video memory use on your system (both per-process and overall usage values) as you might already know, can be very useful when troubleshooting issues with local AI applications and workflows, but also performance issues in some texture-intensive games.
If you’re encountering errors like “CUDA out of memory” errors when using local AI image generation software, extreme slowdowns during local LLM inference, or you notice software like Adobe Photoshop slowing down after extended use, checking which processes are consuming large amounts of VRAM can quickly point you to the source of the issue. Browsers, game launchers, overlays, and background renderers are all common software that can hog VRAM often without you noticing it.
That’s really it. I hope that this short guide was short & simple enough for you not to waste your time. See you next time, hopefully without any more VRAM-related issues!
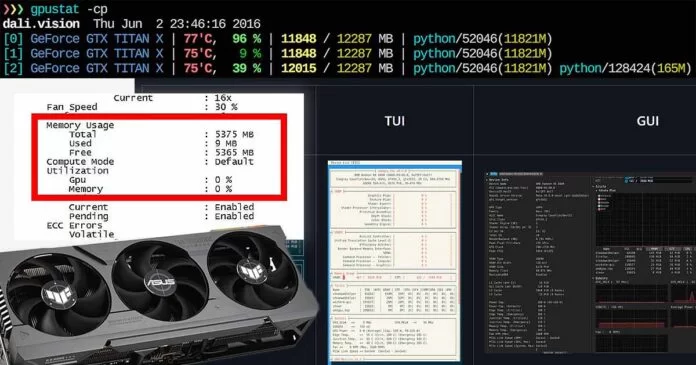
You can read more about monitoring your video memory usage on Linux-based systems here: How To See Current GPU VRAM Usage On Linux? (NVIDIA & AMD)